Overview:
- A scatter plot is a diagram drawn between two distributions of variables X and Y on a two dimensional plane.
- Scatter plot is used as an initial screening tool while analyzing two variables for any relationship (linear, non-linear, inverse relationships) that may exist between them.
- A scatter plot is used only as an initial tool in the process of finding any relationship between two variables. Even if a relationship is found between two variables using scatter plot, it may not be true that one variable influences another variable. To establish relationship between two variables tools like correlation can be used.
Plotting a scatter plot using Pandas DataFrame:
- The pandas DataFrame class in Python has a member plot.
- Invoking the scatter() method on the plot member draws a scatter plot between two given columns of a pandas DataFrame.
- A pandas DataFrame can have several columns. Any two columns can be chosen as X and Y parameters for the scatter() method.
Example 1:
|
# Example Python program to draw a scatter plot # for two columns of a pandas DataFrame import pandas as pd import matplotlib.pyplot as plot
# List of tuples data = [(2, 4), (23, 28), (7, 2), (9, 10)]
# Load data into pandas DataFrame dataFrame = pd.DataFrame(data=data, columns=['A','B']);
# Draw a scatter plot dataFrame.plot.scatter(x='A', y='B', title= "Scatter plot between two variables X and Y"); plot.show(block=True); |
Output:

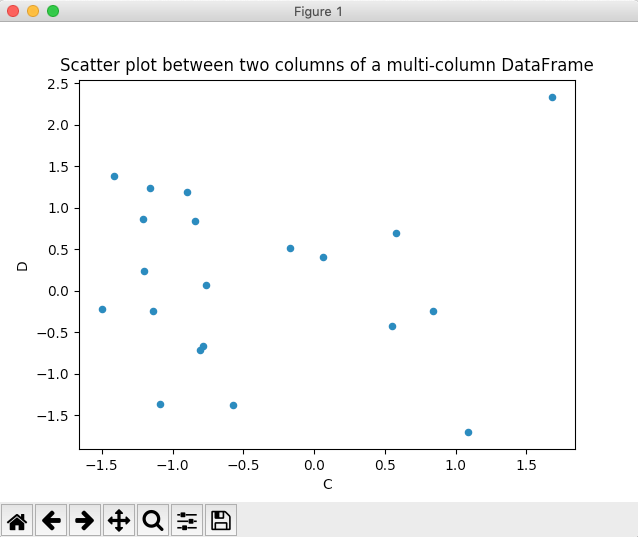
Example 2:
|
# Example Python program to draw a scatter plot # for two columns of a multi-column DataFrame import pandas as pd import numpy as np import matplotlib.pyplot as plot
# Create an ndarray with three columns and 20 rows data = np.random.randn(20, 4);
# Load data into pandas DataFrame dataFrame = pd.DataFrame(data=data, columns=['A', 'B', 'C', 'D']);
# Draw a scatter plot dataFrame.plot.scatter(x='C', y='D', title= "Scatter plot between two columns of a multi-column DataFrame"); plot.show(block=True); |
Output:
